Projects
-
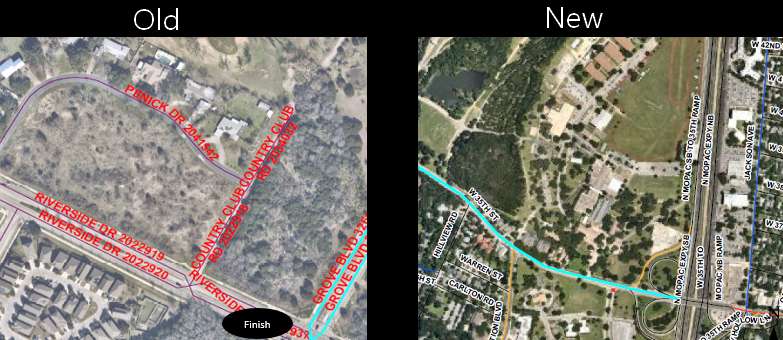
Finding Bike Project Impact Related to Street Overlays in 2020 - Part 2
Read more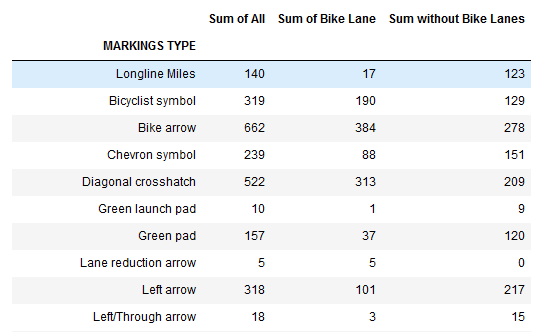 This post is an update of a previous project to create a markings asset counts for each street segment. This update will separate the assets into bike lane and non-bike lane assets.
 -
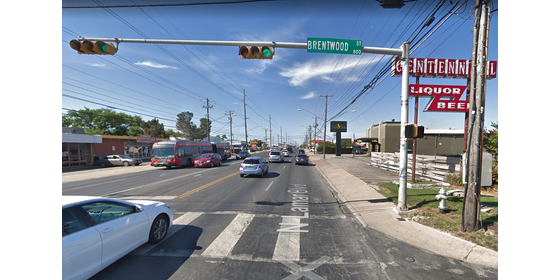
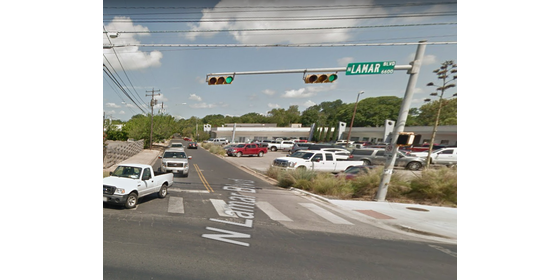
Measuring Retroreflectivity for Traffic Signs
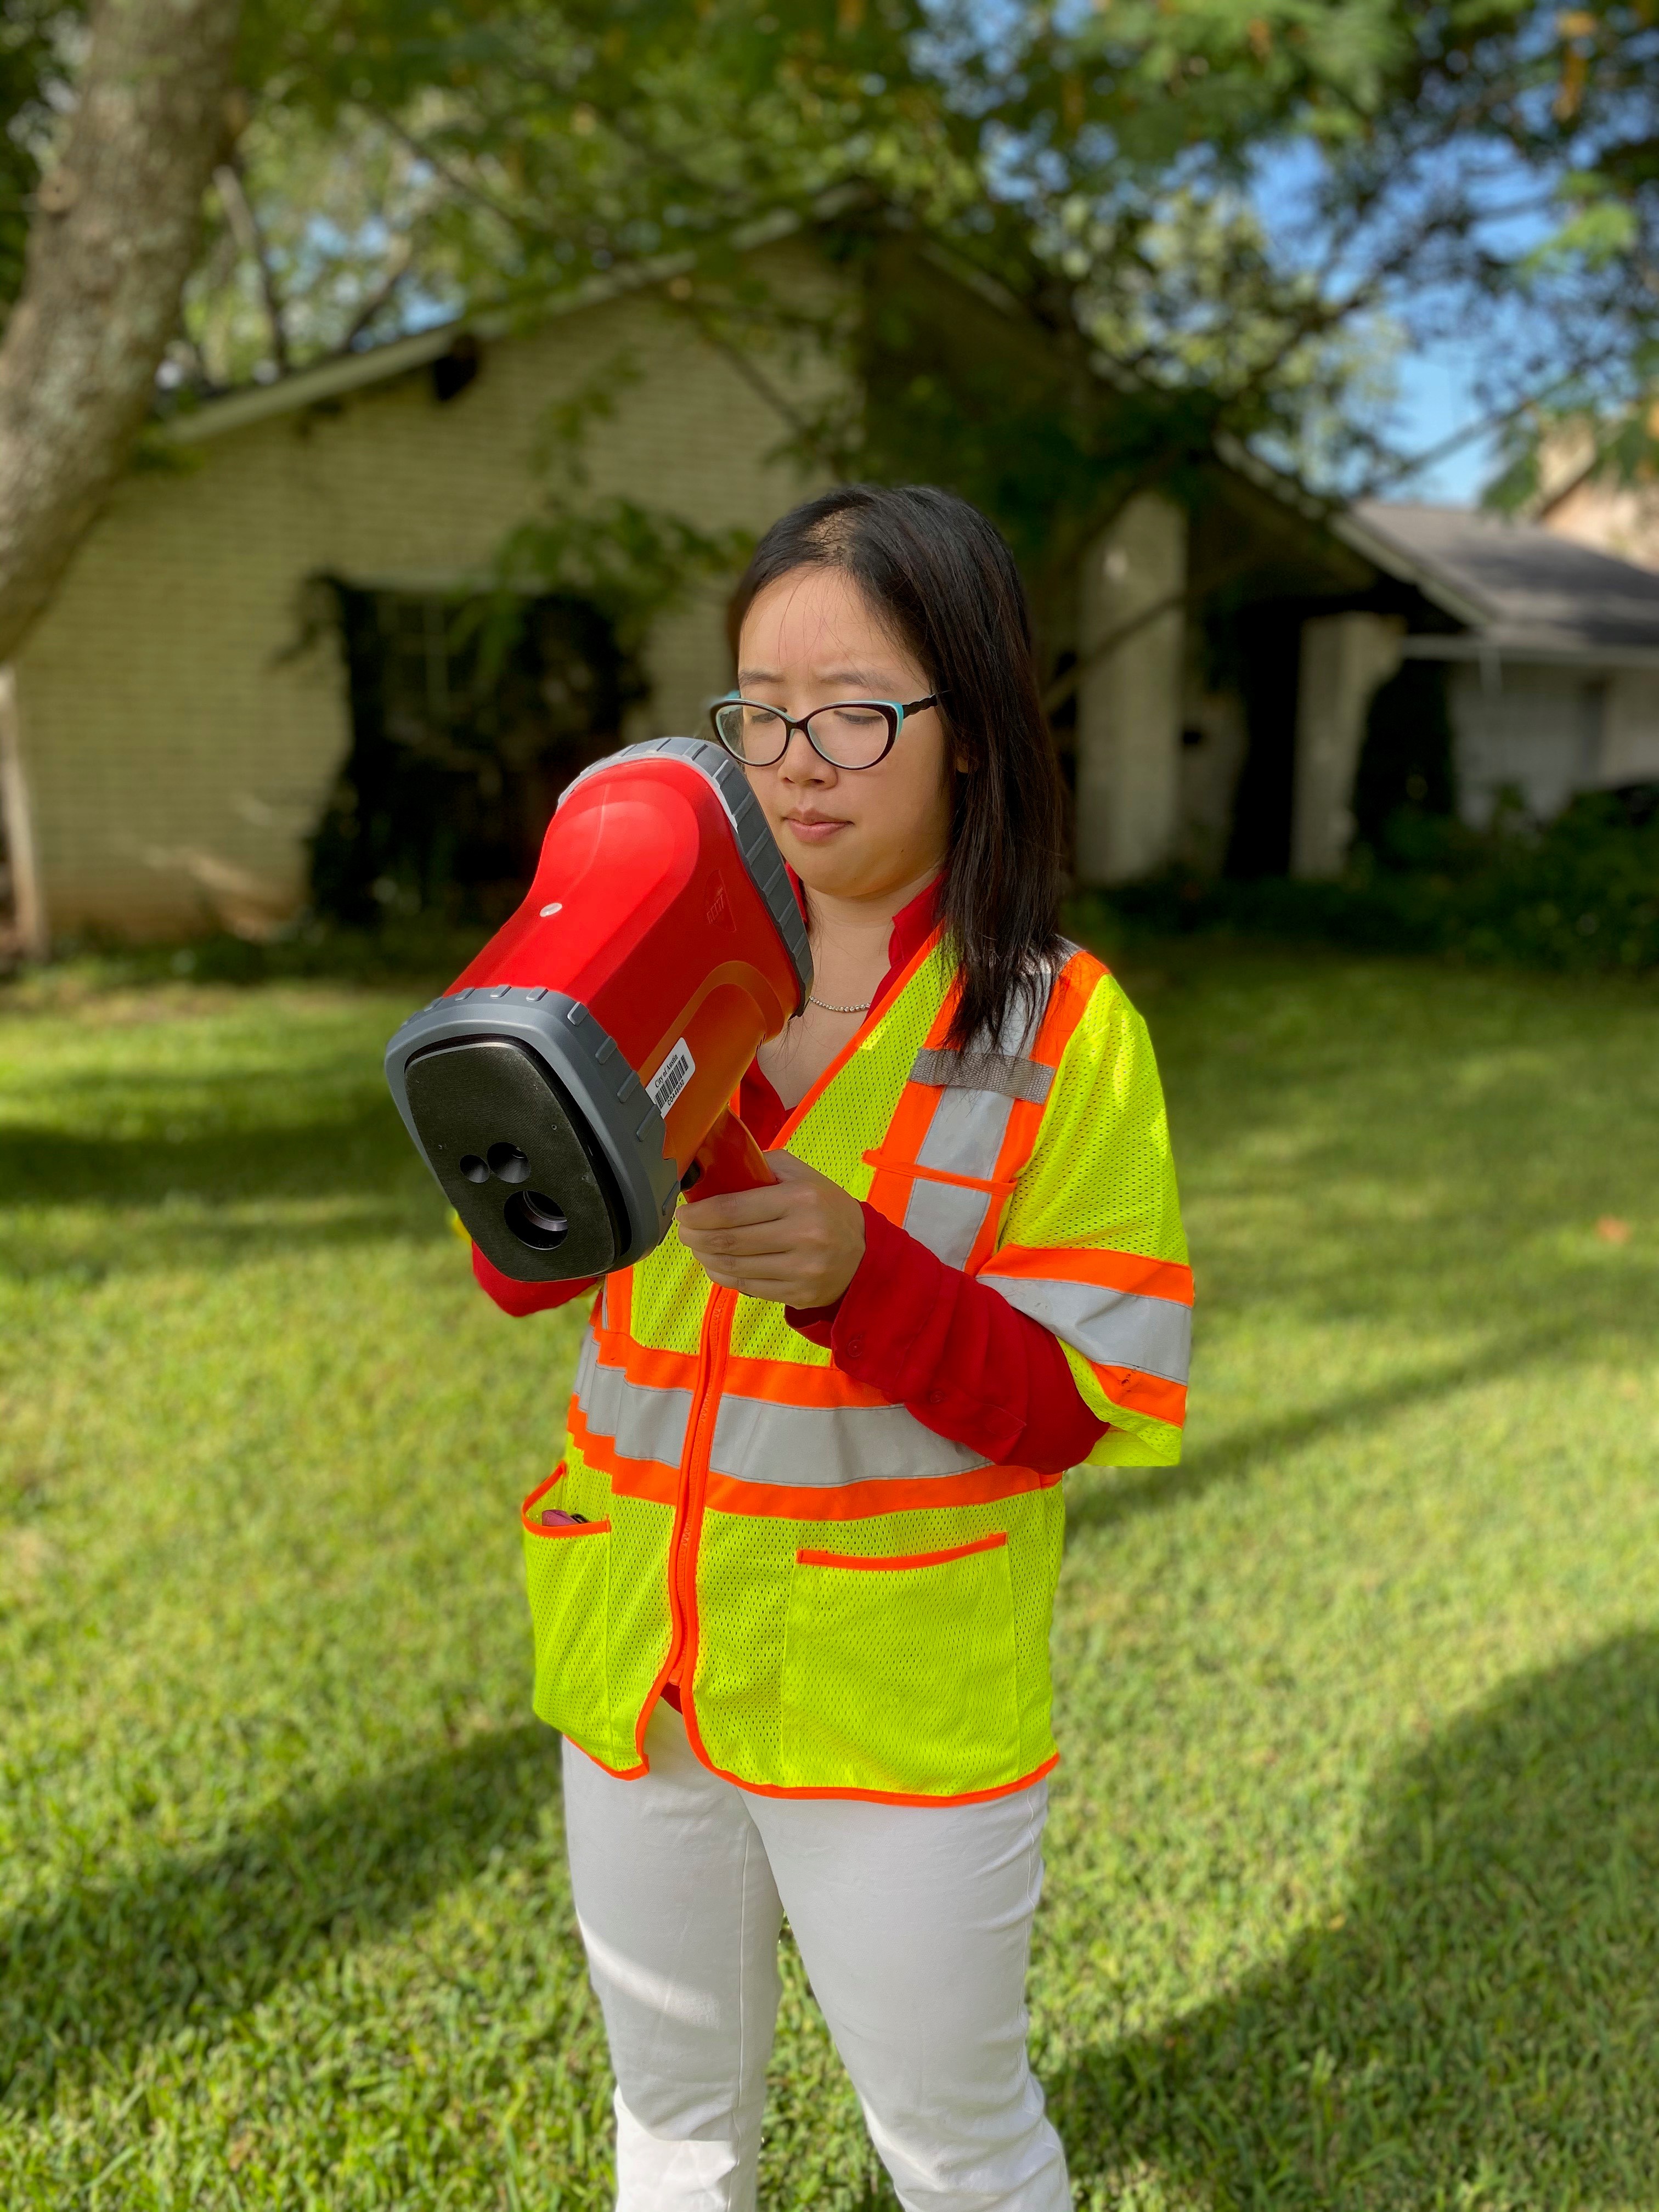
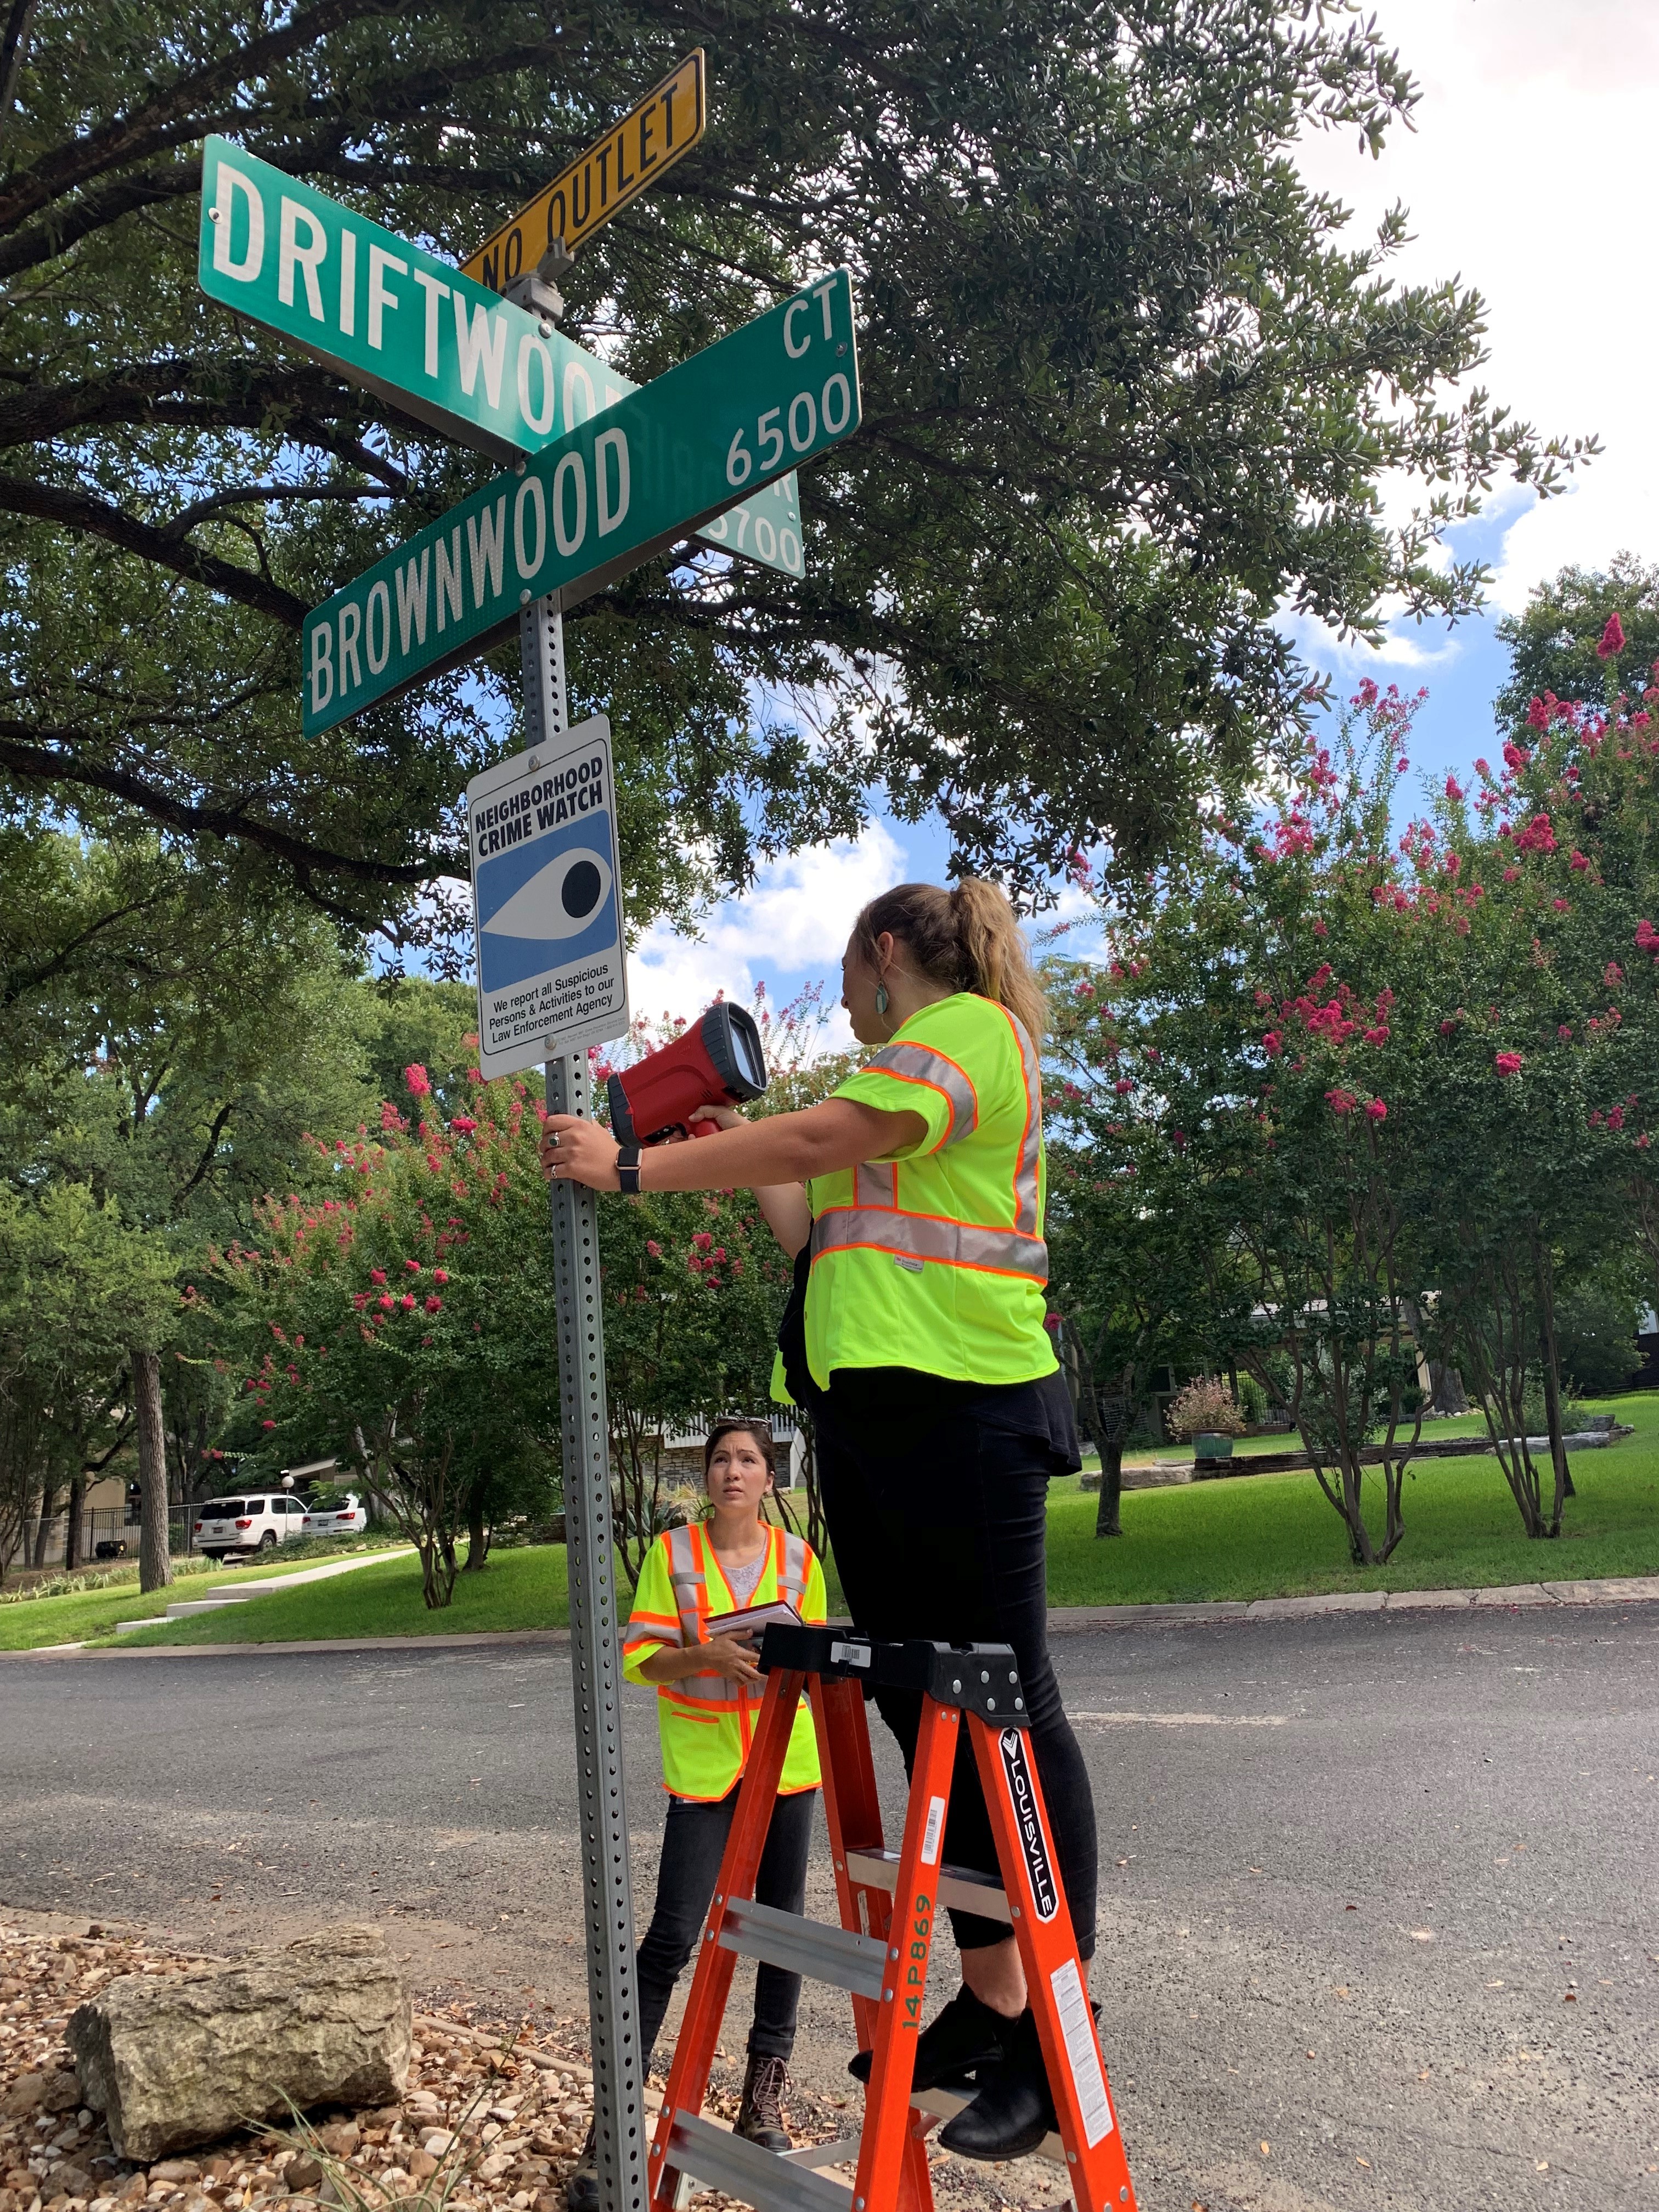
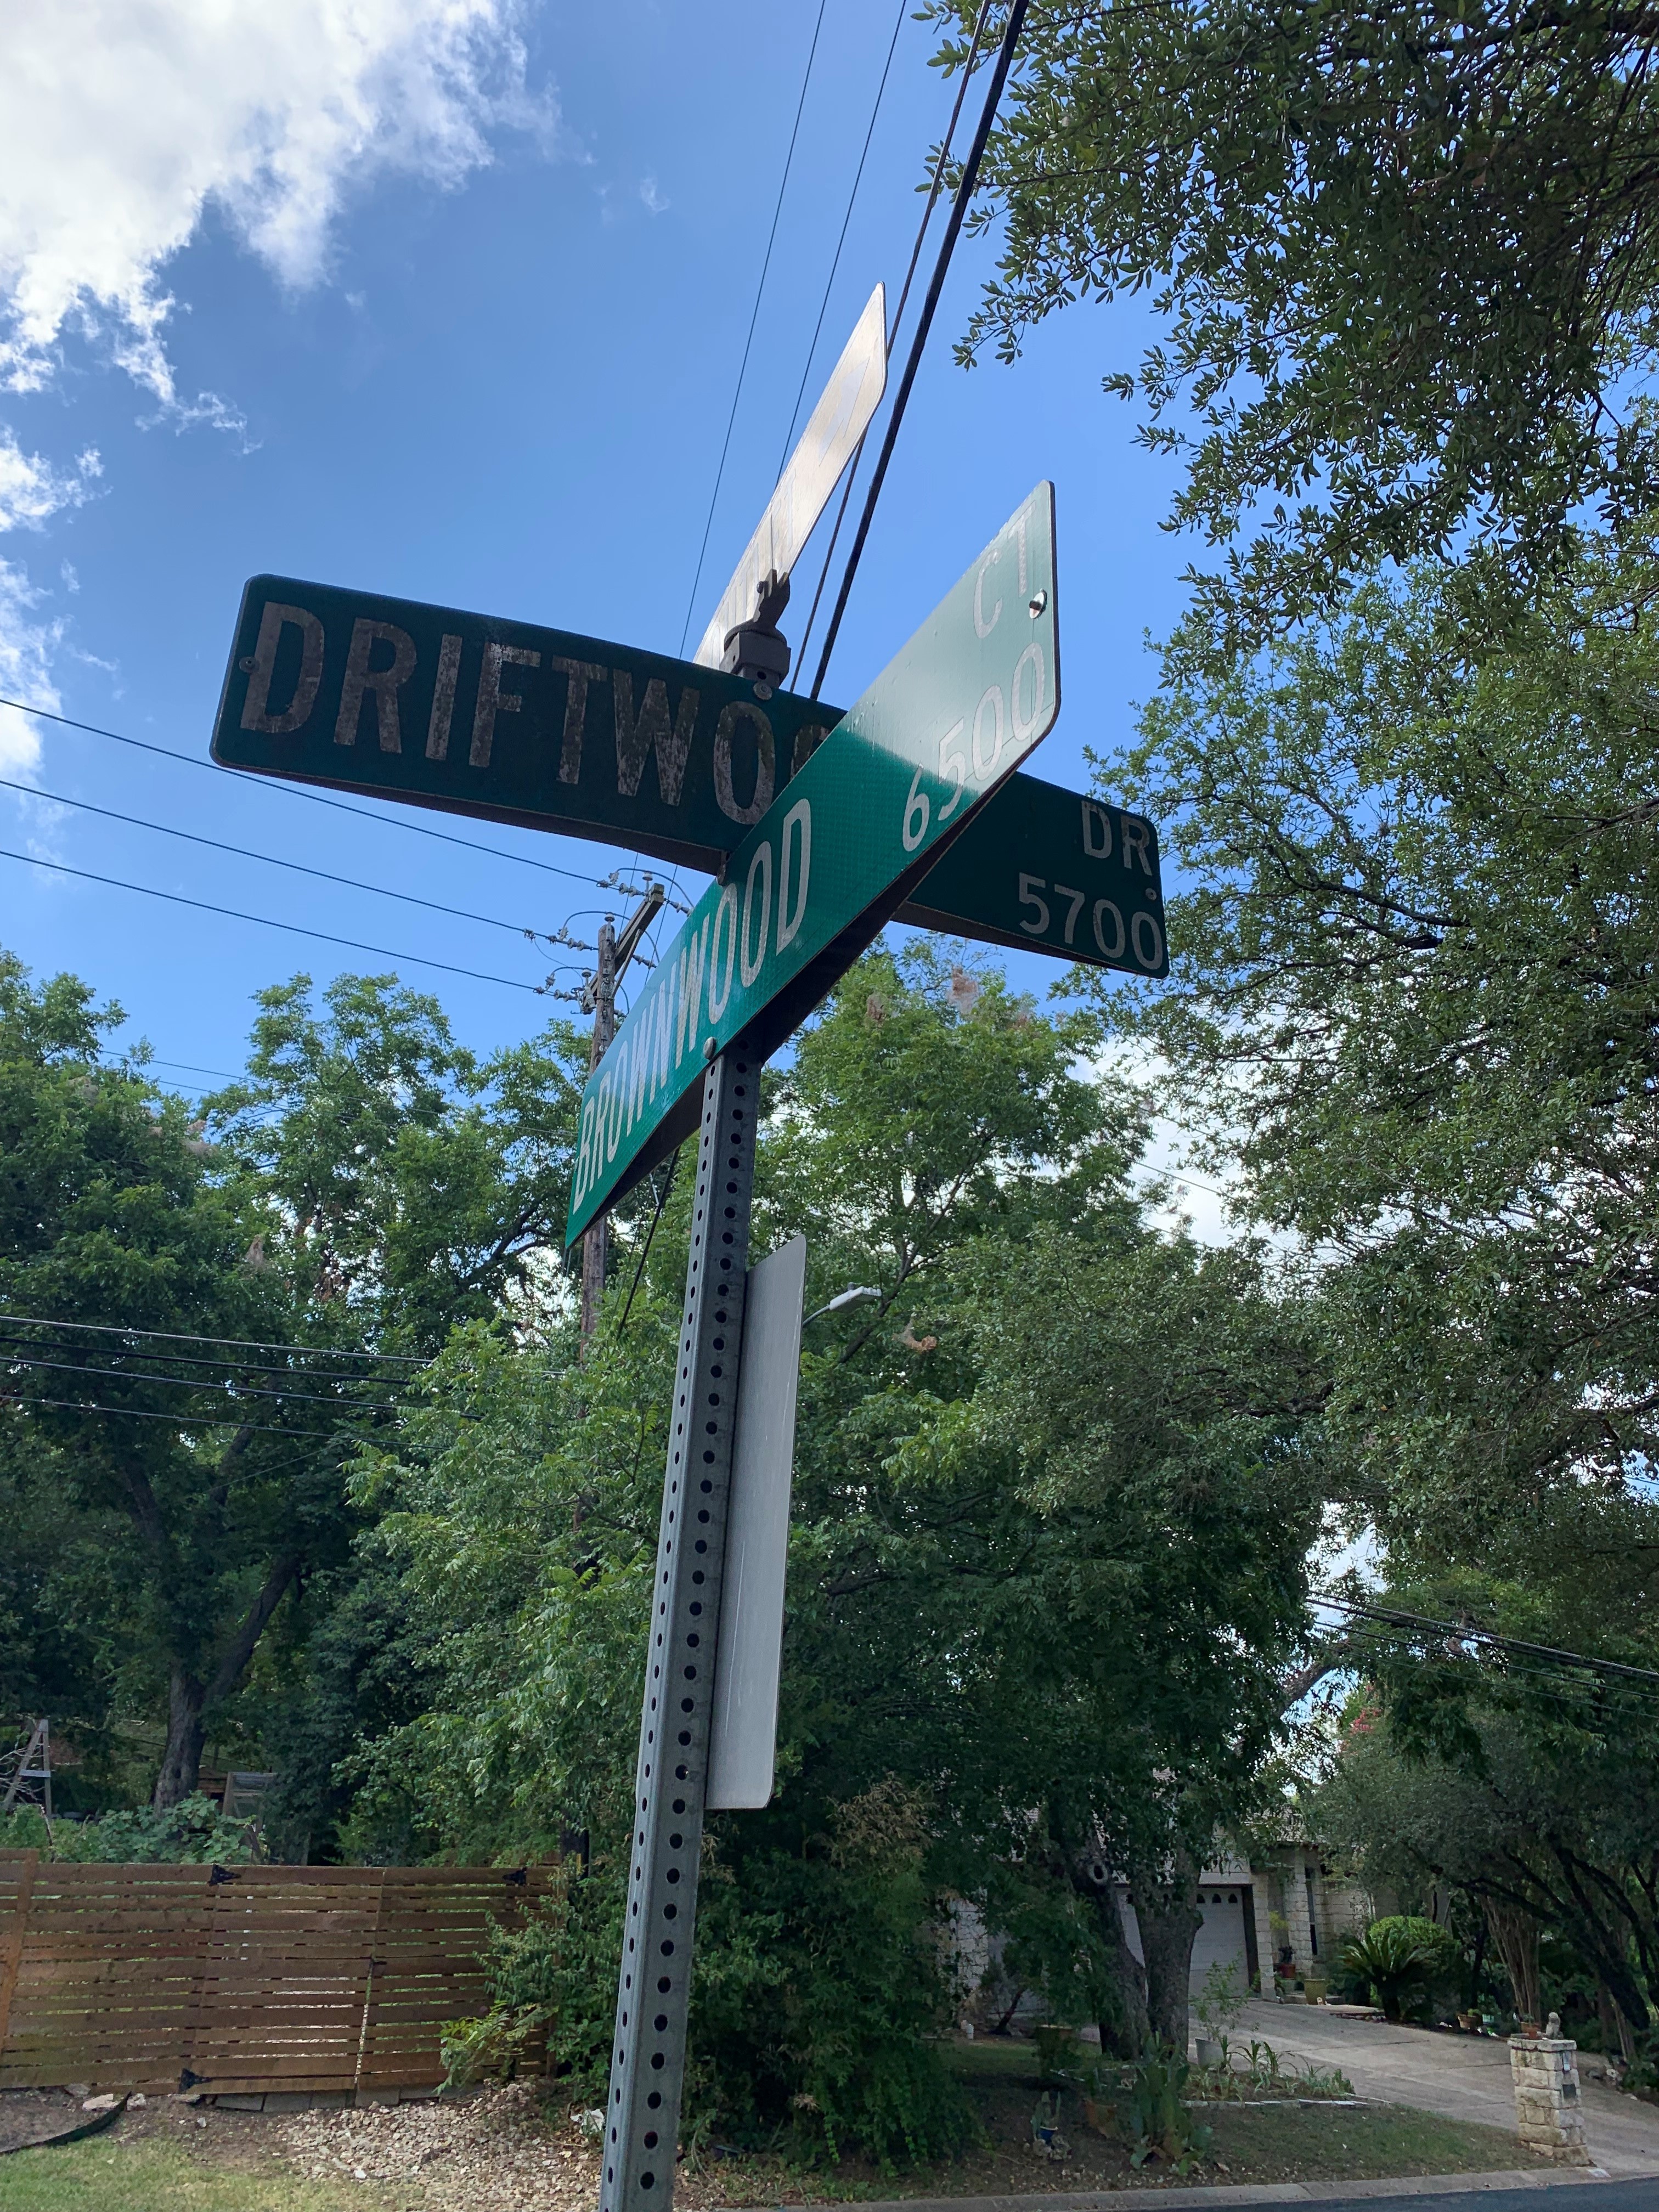
Retroreflectivity is an optical phenomena where a surface returns directed light back at its source. Without retroreflectivity, traffic signs would not be visible at night when headlights hit the sign’s surface. The MUTCD outlines that the retroreflectivity of signs shall be replaced if it fails retroreflectivity tests.
To record the retroreflectivity of traffic signs, a device called a retroreflectometer was used. It is a device that measures the light reflecting properties of signs accurately and reliably.
Read more -
Generate Pavement Markings Plans using Python, Jupyter Notebook, and ArcMap
 This post describes creating a work order plan template using surface streets report to create a pavement markings plan.
Check it out here:
Read more -
Finding Pavement Markings Impact Related to Street Overlays in 2020 - Part 1
Read more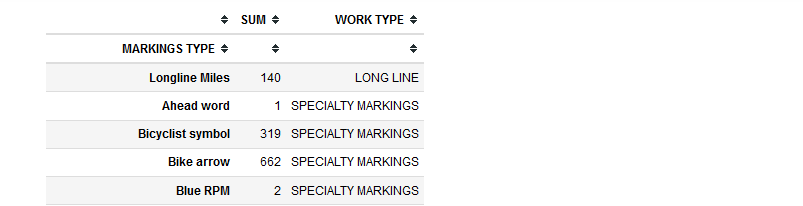 This post will demonstrate how to access attribute table from shapefiles in order to create a markings asset counts for each street segment.
Here is the link to notebook
This post will demonstrate how to access attribute table from shapefiles in order to create a markings asset counts for each street segment.
Here is the link to notebook -
Generating Markings Asset Counts based on Crew Assigned
CREW_ASSIGNED YEARS TOTALS ANNUAL_TOTALS 0 BIKE 4 9590 2398.0 1 CBD 4 2367 592.0 2 OTHER 6 13077 2180.0 3 SIGNAL 6 8326 1388.0 This post will demonstrate how to access attribute table from shapefiles in order to create a markings asset counts for each street segment. Here is the link to notebook
Read more -
Automating Overhead Signs Work Orders Using Python and Microsoft Office 365
This post will demonstrate how to create work orders of overhead traffic signs as part of an established maintenance plan. Here is the link to notebook
Read more -
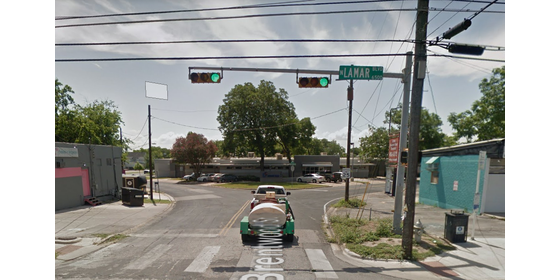
Installation of Pavement Markings at Box Bazaar

Process
Layout was probably the most time-intensive part of the project, which was surprising to me because I was under the assumption it was installation/paving of markings. I think going through the steps of layout really helped me understand the knowledge required in interpreting plans, MUTCD, understanding fractions/division, and coming up with standard procedure on the fly in cases where there are limitations in following plans on the field.
Read more -
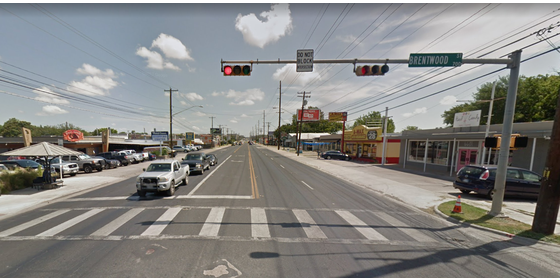
Visualizing Installation of Crosswalks
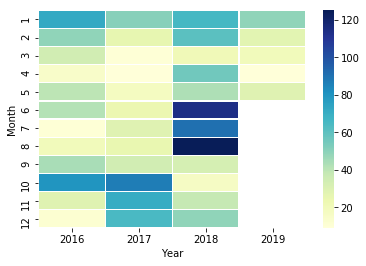
The purpose of this notebook is to visualize the markings assets represented by installation date and total pavement markings assets maintained within the City of Austin full jurisdiction. Packages used for visualization include
Read morearcgis,pandas,seaborn, andbokeh. -
Calculating Annual and Total Costs of TxDOT Roadways using Python and Microsoft Excel
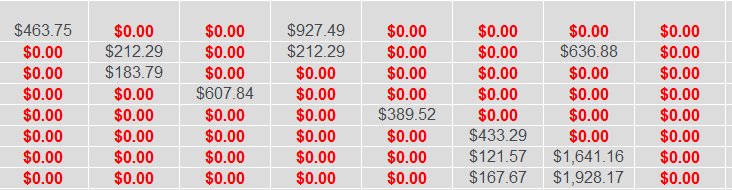
This post will demonstrate how to create an excel file detailing the total number of assets, the total costs, and the annual costs. Here is the link to notebook
Read more -
Creating Markings Asset Application using ArcGIS Online and Web App Builder

I created a web map application of pavement markings assets using street segment ID for spatial reference for markings work. Link to web application (Requires city account).
Read more -
Creating Affordable Parking Application using ArcGIS Pro, ArcGIS Online, and Web App Builder

I created a web map application of affordable parking garages for the Affordable Parking Program, a City of Austin initiative aimed at reducing economic barriers by making parking cheaper, safer and more reliable for service and entertainment business employees. Link to web application.
Read more -
Creating Pavement Markings Work Orders Application using Related Tables, ArcGIS Online, and Web App Builder

I created a web map application of completed pavement markings work orders submitted through the data tracker. Link to web application.
Read more
subscribe via RSS